Go Splunk Yourself!
Filed Under Gadgets & Hardware, Geek, Self Tracking | 2013-10-17, 10:29
Full Disclaimer: I’ve been working at Splunk for close to 4 years now as a software engineer. For those that aren’t familiar with Splunk, it’s a tool intended to collect machine generated data (aka log files), index it, and allow you to search and report on it. Most companies use Splunk in their IT department to monitor and troubleshoot problems, but it’s really starting to branch out into all areas of businesses. After discovering Splunk, it didn’t take long for me to realize I could use it myself even though I wasn’t running a huge IT department. Of course I threw a bunch of my web server logs at it and started fixing errors, but that’s par for the course. Things started getting interesting when I decided I was going to Splunk myself.
With the rise of the Quantified Self movement, more and more biometric devices and self-tracking tools are becoming available to normal consumers. As we start using more devices that track more variables, the amount of data generated frows exponentially. Devices like the Basis allow you to track things like your heart rate or skin temperature on a minute by minute basis, resulting in thousands of data points every day. It’s debatable whether we can call this “Big” Data since it only accounts to a few megabytes, but it definitely scales outside the realm of manual handling very quickly.
![]()
The Basis is just one device that you can use to help track yourself. There are hundreds more. Personally I’m currently (or within the past year) tracking the following:
Hardware:
- Fitbit Zip – steps (also tracking my cat Bunki with a Fitbit)
- Nike Fuelband – steps and activities
- Basis B1 Band – steps, heart rate, skin temperature, air temperature, and galvanic skin response
- Withings scale – weight and fat mass
- Garmin Forerunner 610 – GPS location, heart rate (paired with a Wahoo ANT+ HRM), and pace for my runs and bike rides
- Lumoback – posture
- Zeo – brain activity during sleep (Company out of business)
- Automatic – tracking car trips, mpg, and driving habits
Software:
- Moves (iOS/Android) – steps, passive tracking of places I’ve been, cycling, running
- Openpaths (iOS/Android) – geolocation
- Google Latitude (service discontinued) – geolocation
- foursquare (iOS/Android) – active tracking of places I’ve been
- Last.fm – Music listening habits
- Biologger – a custom web based app for tracking things like sneezes, last time I cleaned the litterbox, did the dishes, headaches, dyed my hair, etc.
- Email inbox – custom script for checking number of read and unread messages in my inbox
- Twitter – tracking my tweets @edrabbit
Each of these devices or apps has their pros and cons. Battery life, ease of syncing, and of course quality of data are all factors. But the biggest issue I ran into with Splunking myself was getting my data out of all these services.
If I was really lucky, a full-featured API was available (like Fitbit’s). Other times I had to settle for an export in CSV or some other format (like Zeo). Unfortunately there are a few services/devices that just don’t offer any official way to get your data out (I’m looking at you Basis).
Over time I was able to find a number of tools written by others to help free your data. Additionally I wrote several of my own tools to extract data and transform it into human-readable and Splunk-friendly log formats. All of my tools are available on my github page. I’ve got tools to fetch and/or format data from Fitbit, Nike Fuelband, Twitter, Google Latitude, GPX files, CSV files, Zeo, foursquare, and Basis.
But wait, I said Basis didn’t have any way to get your data out! As an excellent example of users finding ways to use things the way they want, there is a way to get your data out of Basis. One Basis user (Bob Troia) discovered that while Basis doesn’t offer an API to user, they do have an internal API where JSON is passed through the browser in order to show you dashboards with your data. All it took was a little bit of scripting to grab this automatically and suddenly we all had control of our own data. You can find his Basis Data export tool here. This was great, but the data was exported in a horrible combination of JSON and CSV. Luckily one of my scripts can turn it into minute by minute log files as if they were generated on the fly. There are a bunch of other self-tracking hackers out there building tools like this. They’re often easy to find, but to help I’ve started to try to catalog them at wiki.biologger.com
Armed with all these devices generating data and the appropriate tools for fetching and formatting it correctly, I was finally able to feed all of this into Splunk. Let’s take a look at some of what I’m able to get out of this.
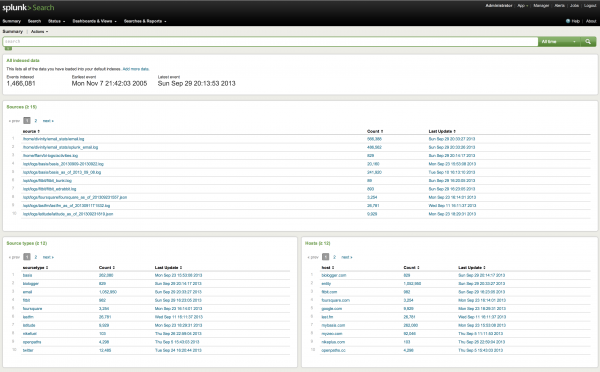
I have around 1.5 million events logged in Splunk, taking up only a couple hundred megabytes. For anyone already familiar with Splunk, this is obviously within the 500mb index limit of the free product, which means anyone can do this without shelling out cash for a license.
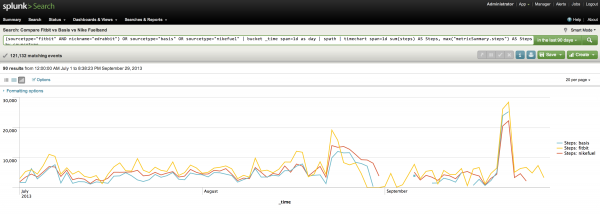
One of the most common questions when people learn I’m using all these devices is how they compare to each other. Previously I could only give a vague sort of answer about how I thought the Fitbit was the most accurate and that the other devices where a few thousand off each day. But with Splunk I’m able to generate a visualization comparing the Fitbit with the Basis and the Fuelband. It’s true, they don’t give similar numbers, but they do seem to track similarly over time.
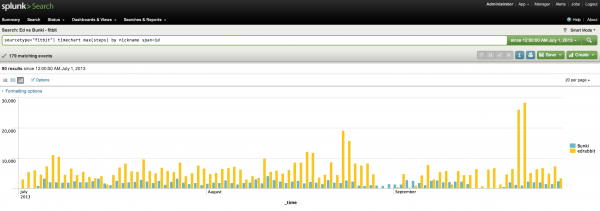
How do I compare to Bunki in steps?
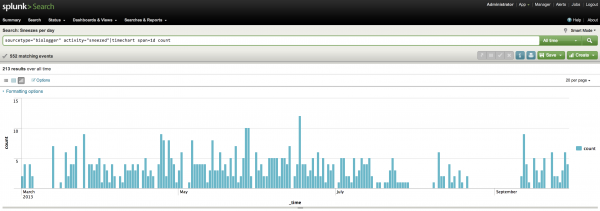
How many times have I sneezed each day?
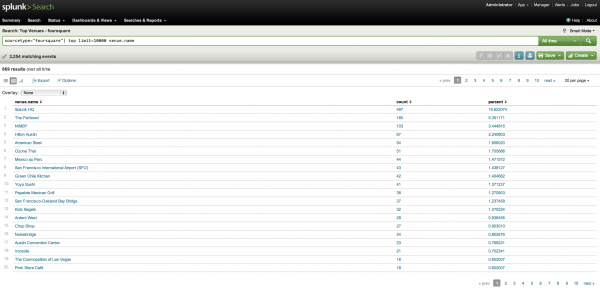
What venues have I checked in at with foursquare the most over the past 8 years?
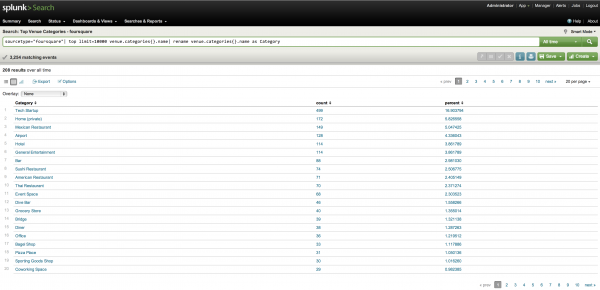
What kind of venues do I tend to check in at?
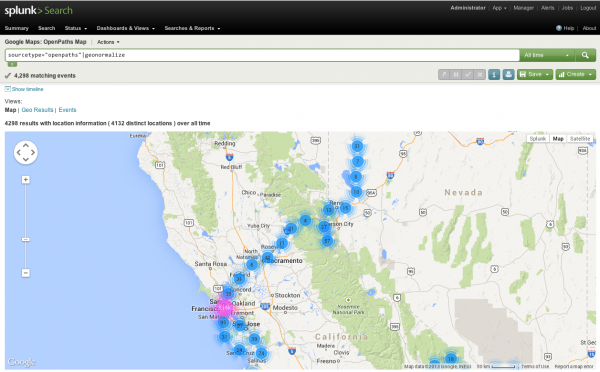
With the Google Maps App for Splunk 5 I can even plot all of these checkins on an interactive map. (The newest version of Splunk 6 comes with maps built in)
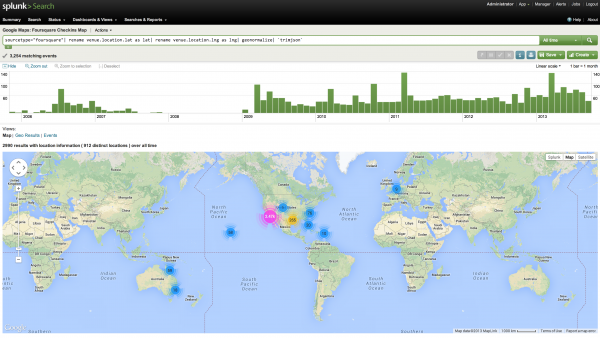
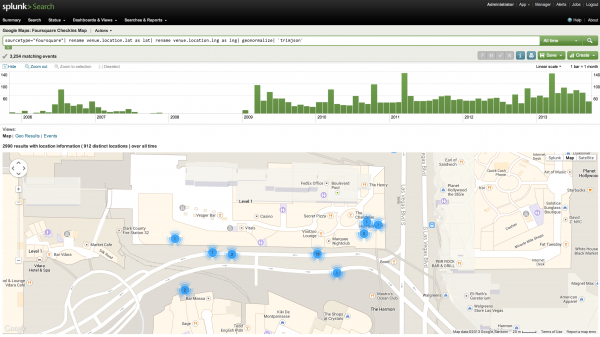
I can also use this to see exactly where I went on trips, what restaurants I ate at, and what activities I did. So next time a friend asks what’s good to do in a city I’ve visited I can just pull up the map and show them exactly where to go. Here’s an example map from Splunk’s .conf in Vegas last year:
The maps above are based on foursquare data, which requires active check-ins at specific venues. However tools like Google Latitude and Openpaths simple record latitude and longitude over time, so you get a more detailed report on my movements. Here’s Openpaths tracking me around San Francisco and my journeys to the Black Rock Desert.
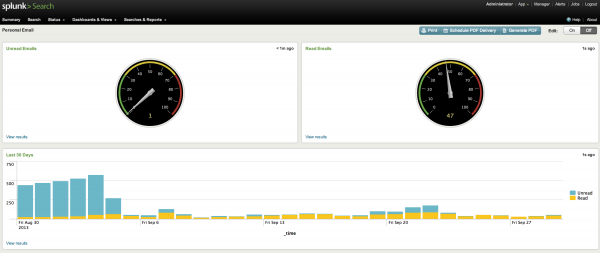
Or how about the current state of my email inbox? I’m tempted to put this up on a screen at home so I can see how many unread messages I have without having to open up my inbox.
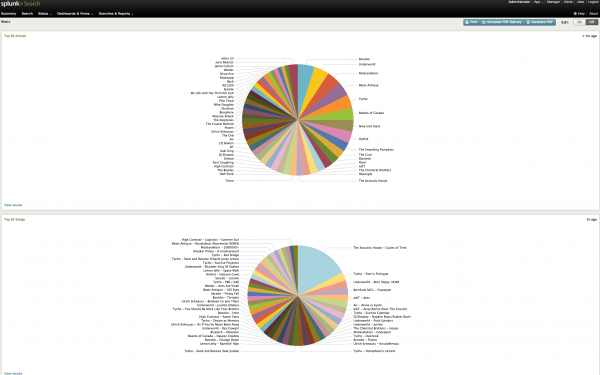
What about my favorite music based on Last.fm? This is an interesting one that also shows off how multipurpose Splunk can be. As you can see I listened to a single song (The Acoustic Hoods – Cycles of Time) several times more than all other songs. In Splunk I can click on that pie piece and it will show me every single time that song was logged as played. Turns out I left the song running on repeat on my work computer when I went home for the evening and it looped all night long. Oops. Luckily with Splunk it’s easy to just exclude those events to get a more realistic picture if that’s what I wanted.
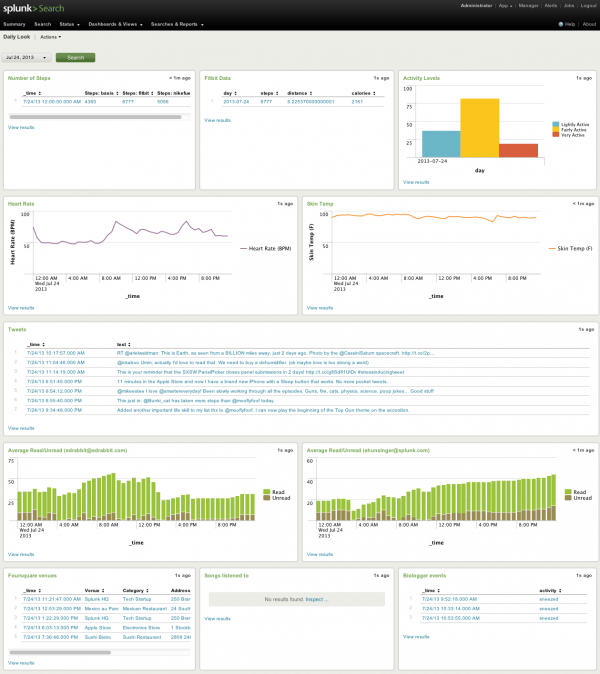
This is all pretty simple stuff that even the newest of Splunk users can do. It’s mainly looking at just one data source. What I really wanted was to be able to see a picture of any day of my life and know what that day was like for me. SO I put together a dashboard that lets me do just that. It pulls in info from various different services that have vastly different formats and lets me see it all on one page instantly. No more clicking from site to site to site. I’m still working on getting more and more relevant data in, but if you take a look at the screenshot below you’ll see exactly what July 24th, 2013 looked like for me. Based on my heart rate around 9am and 6pm it looks like I biked to work, I ate lunch at Mexico au Parc, went to the Apple store to get my iPhone replaced, sneezed 3 times in the morning, and learned how to play Top Gun on the accordion.
What’s next?
Keen-eyed Splunk users will notice in the Summary screenshot that some of the data sources are data dumps and not actually feeding into Splunk live. I want to work on getting everything feeding into Splunk automatically so it is all constantly up to date rather than have to take 20 minutes to sit down and get new data dumps from the various services.
I also want to start Splunking my house. I’ve got a Nest, a wifi washing machine, and more and more devices becoming internet enabled. It’s just a matter of grabbing it and feeding it into Splunk.
You can download the free version of Splunk which is available for almost every platform, or you can give our hosted (and also free) Splunk Storm a try. There’s a slight learning curve to using Splunk, but if you can use Google, you can learn to use Splunk. I’d love to hear from anyone else out there that either wants to or already has started Splunking themselves. Shoot me an email or drop me a tweet @edrabbit!
-
Subscribe

Subscribe to my feed -
Twitter
-
My Other Stuff
-
Find It
-
Sites I Like
-
Archives
- August 2014
- May 2014
- April 2014
- February 2014
- November 2013
- October 2013
- September 2013
- July 2013
- June 2013
- May 2013
- January 2013
- September 2012
- August 2012
- July 2012
- May 2012
- March 2012
- February 2012
- September 2011
- June 2011
- May 2011
- March 2011
- December 2010
- June 2010
- April 2010
- March 2010
- February 2010
- January 2010
- December 2009
- November 2009
- October 2009
- September 2009
- August 2009
- July 2009
- June 2009
- May 2009
- April 2009
- March 2009
- February 2009
- January 2009
- December 2008
- November 2008
- October 2008
- September 2008
- August 2008
- July 2008
- June 2008
- May 2008
- April 2008
- March 2008
- February 2008
- January 2008
- December 2007
- November 2007
- October 2007
- September 2007
- August 2007
- July 2007
- June 2007
- May 2007
- April 2007
- March 2007
- February 2007
- November 2006
- October 2006