Creating Supercut Videos with Python
Filed Under Art, Geek, Tools, Video on 2014-08-26, 22:01 | Leave a Comment
Videogrep: Automatic Supercuts with Python
Videogrep is a python script that searches through dialog in videos and then cuts together a new video based on what it finds. Basically, it’s a command-line “supercut” generator. The code is here on github.
More explanation and examples can be found on Sam Lavigne’s blog post.
Botanical Art Above the Black Rock Desert
Filed Under Art on 2014-08-02, 20:27 | 1 Comment

With Burning Man quickly approaching again this year, the thought of art presented upon the canvas of the vast Black Rock Desert is in the minds of many people. However botanical artist Makoto Azuma thought art should take place not on the playa but 100,000ft above the Black Rock Desert. With the help of a team of people and some helium balloons, several plant creations were sent soaring into space.
From the EXOBIOTANICA page:
Plants on the earth rooted in the soil, under the command of gravity.
Roots, soil and gravity – by giving up the links to life, what kind of “beauty” shall be born?
Within the harsh “nature”, at an attitude of 30,000 meters and minus 50 degrees Celsius,
the plants evolve into EXBIOTA (extraterrestrial life).
A pine tree confronting the ridge line of the Earth.
A bouquet of flowers marching towards the sun hit by the intense wind.
Freed from everything, the plants shall head to the space.
-- 1 Comment
The Missoula Fire Lab
Filed Under Fire, Video on 2014-05-28, 20:51 | Leave a Comment
The Missoula Fire Lab sounds like a place I’d love to work, or at least visit:
The Missoula Fire Sciences Laboratory staffs over 10 world renowned scientists in addition to wide-ranging and accomplished support personnel. The lab is equipped with state-of-the-art burn chambers, comprehensive laboratory facilities, extensive computing resources, and novel field instrumentation which provide a unique environment to conduct innovative wildland fire research. Original research at the Missoula Fire Sciences Laboratory includes: fire behavior prediction modeling, soil heating modeling and effects, landscape fire ecosystem dynamics, smoke emissions and dispersion modeling, and fire danger rating.
The video above, produced by The Atlantic, features some absolutely gorgeous high res slow motion video of flames flickering.
via Laughing Squid
Building a Better Cat Bathroom
Filed Under Gadgets & Hardware, Geek, Lifehacks on 2014-04-21, 14:19 | Leave a Comment
I’ve had cats for many years. This means I’ve had to deal with litter boxes for just as long. When you have one cat, it’s not a big deal. However when you have three of them, like we do, the litter box challenges are greater. For years I dreamed about solving all of these challenges with the perfect litter box situation. We haven’t quite achieved that level of greatness, but what we’ve put together is pretty damn close.
With 3 cats we’ve had 2-3 litter boxes. They’ve been placed in laundry rooms, bathrooms, kitchens, closets, showers, tubs, and just about anywhere in an attempt to make them work. Up until now we rented, so we never wanted to invest the time or money into a more permanent solution. Plus none of our rental apartments had the space for it! When we finally bought a house last year, we resolved to finally solve this problem: Introducing the Cat Bathroom.
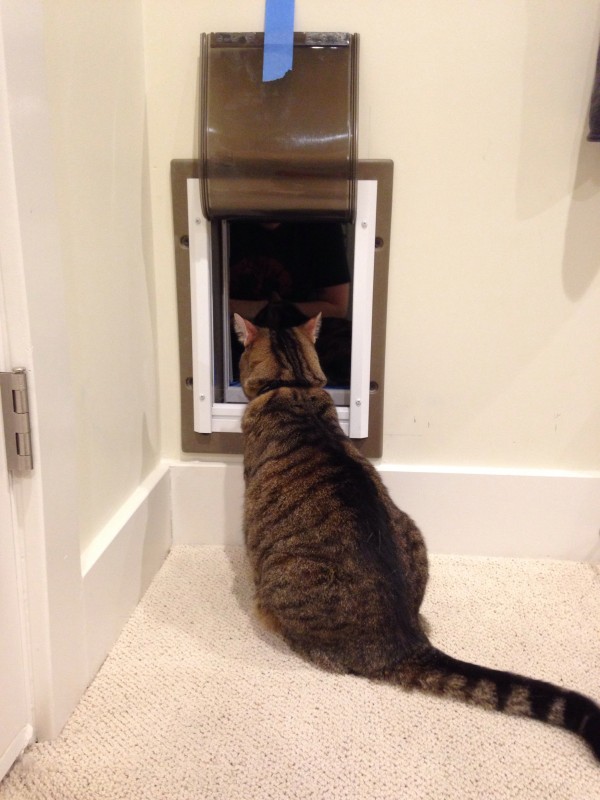
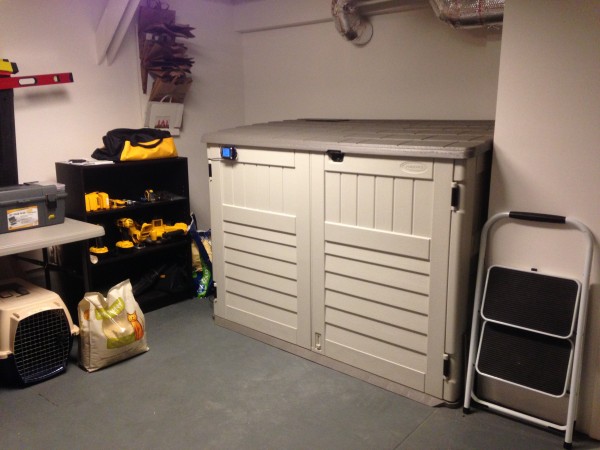
The Cat Bathroom was originally designed as an additional room with framing and doors and whatnot, but then we found a garden shed that was the perfect size. It comfortably holds 3 litter boxes and gives the cats plenty of room to walk around and do their business. In a single afternoon we assembled the shed, cut a hole in the side with a jigsaw, and then cut a hole in the wall between our downstairs room and the garage so that we could install the cat door. The cats love it, and we’ve had almost no “registering of complaints” in other areas of the house.
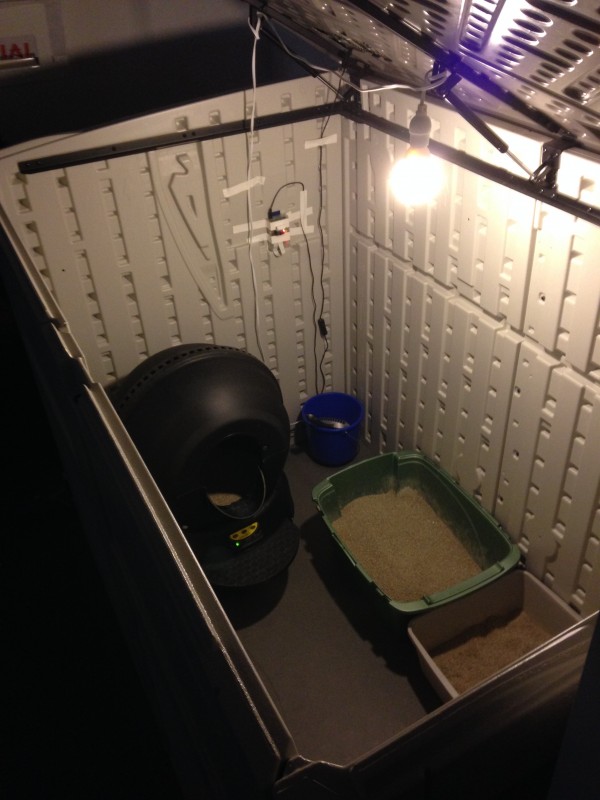
Inside the Cat Bathroom we have three litter boxes. One of the litter boxes is a Litter Robot, which cleans itself. I highly recommend these if your cat will use it. Some of our cats aren’t as fond of it, so we’ve still got two normal boxes. In order to get into the Cat Bathroom, the cats have to climb through the pet door. Since it’s not level with the ground, the cats don’t track the loose litter out into our living space. No longer do we have to step on litter when using a “shared” bathroom barefoot. The shed also has two large doors that swing open and a hydraulically assisted lid that allows for super easy cleaning of the boxes. Because it’s already in the garage it means we never have dirty litter sitting in the house waiting to be taken out.
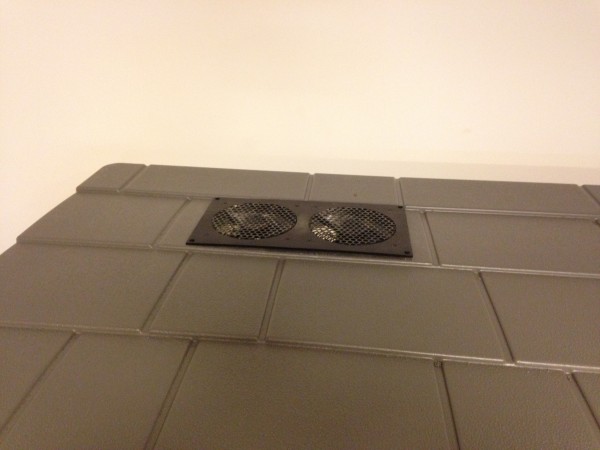
We learned a very important lesson after the first few days of the Cat Bathroom: ventilation is important. The smell of opening the lid after the first few days was overpowering. A simple exhaust fan found on Amazon and some more jig saw cutting and that problem was easily solved. It exhausts into the garage, which has enough air flow that the smell is never noticed. Gone are the days of nice dinners ruined by the smell emanating from the corner of the kitchen.
Most people would probably stop with that setup and call it good. However I’m not “most people” and wanted to make it a little bit fancier. I’ve already implemented a large amount of home automation with Insteon/X10 hardware and Indigo software. Since I already had that all setup, and I had a leftover X10 motion sensor, I decided to use it — in conjunction with Splunk — to track how often the cats used the litter box. It was an excellent way to make sure full adoption of the Cat Bathroom was happening at the beginning.
The X10 motion sensor sits right inside the door, so the cats trigger it whenever they walk in. It sends a signal to an X10 receiver, which is then picked up by the Indigo software. The Indigo software logs the trip, increments a variable counting the number of trips, and then calls a custom python script that posts a randomly selected message to the Twitter account setup for the @CatBathroom. The Twitter account has 13 followers. I’m still not sure why.
"Why are you following @catbathroom?" – @edrabbit
"YOU'RE the one who made a account about your cat's litterbox. WE aren't the weird ones."
— KC (@KdotCdot) January 29, 2014
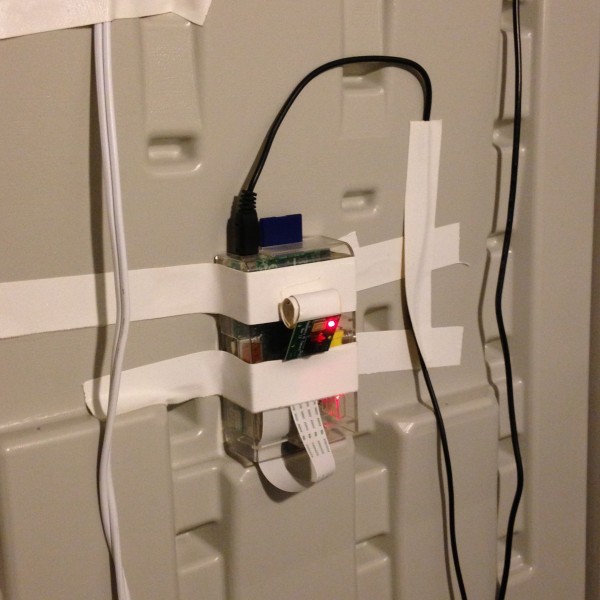
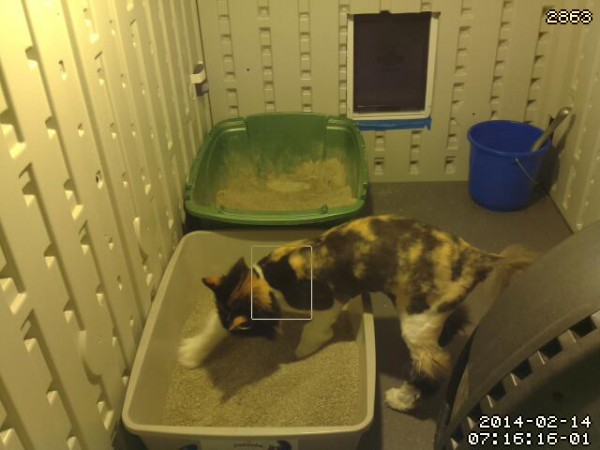
As part of “making sure the cats are using it” I wanted a way to know which cat was using it so we were sure all 3 of them were on board. I happened to have a Raspberry Pi and a camera module sitting on my desk. A little bit of work later and I had motion triggered video recording setup with it. As you can see, I’ve opted for the super high-tech “wad of tape” method of mounting and aiming the camera. I also found out that the Raspberry Pi camera wasn’t so hot at low-light, so I hung an LED bulb in there that’s always one. I like to think that in addition to making the camera work, it also makes the Cat Bathroom friendlier than the dark cave it used to be.
Now we have security camera style footage of the cats using the bathroom. Yes, it’s weird to watch it. If anyone needs almost 2gb of cats and litter boxes for a bizarre art project, get in touch with me. I will admit, there’s a bit of a temptation to hook up automated photo uploading to the Twitter account. Be warned.
The Cat Bathroom solved many of our problems, but it turned out that it caused one rather big one. Since the litter boxes were hidden away from sight, we had a tendency to forget about them. This meant it would be several days before we realized “oh yeah, we need to clean the litter boxes”. Needless to say the cats were a little unhappy about it. Enter an over-engineered solution…
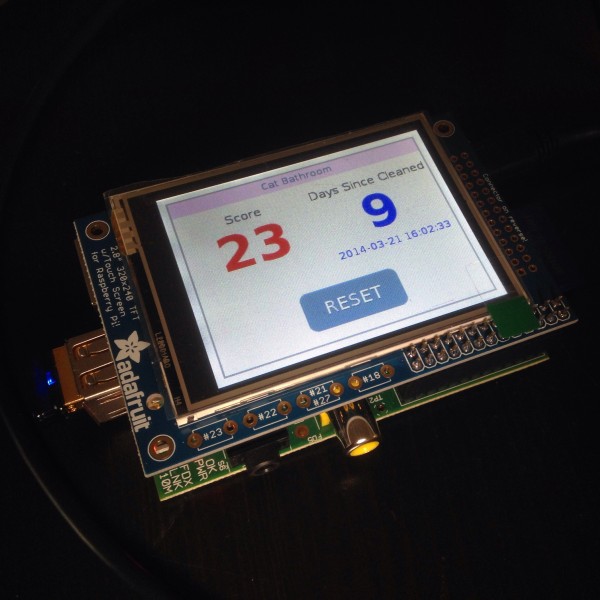
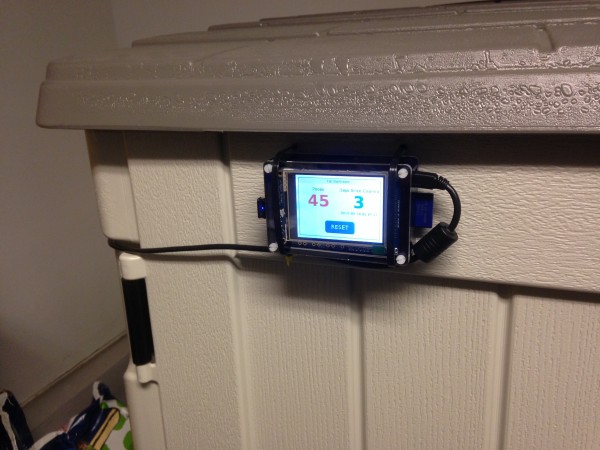
Another Raspberry Pi plus a small LCD touchscreen for display was the hardware of choice. I threw together a super simple flask based webserver that would query the Indigo API for the number of trips the cats had made to the bathroom and also calculate how many days it had been since the last cleaning. If either number gets to high, it turns red to draw attention to our lack of diligence. And there’s a button to tap when I clean the litter box, which resets the counters (and of course sends a tweet). I noticed it occasionally crashing and not reloading the page, so I tossed it on a WeMo switch so I can reset it easily.
You can check out the code I’m using over on github. I’m hoping to turn it into a more full-fledged house server with more than just the Cat Bathroom status at some point.
Another smaller problem I ran into was that the cats had learned to jump directly into the Litter Robot, bypassing the step that triggers the countdown to cleaning. This meant the Litter Robot wasn’t cycling and cleaning itself after every use. Sure I could just go in there and manually switch it off and back on again in true “IT Crowd” fashion to force a cleaning, but that’s too easy. I had a WeMo switch left over from our Christmas tree lights, so I plugged the Litter Robot into it. Now I can clean one of the litter boxes from my phone.
So what’s next for the Cat Bathroom? RFID collars and litter box weight analysis are just some of the suggestions I’ve heard. But I wouldn’t want to get too carried away with this…
Cost breakdown
Suncast 3′ x 8′ x 5.11′ Storage Shed – $350
Pet Door – $88
Cabinet fan for exhaust – $35
Raspberry Pis, camera, LCD, motion sensor, WeMos, etc – [REDACTED]
Not stepping in cat litter when getting out of the shower: Worth every single penny.
More Pictures in the Flickr Set
List of New Facebook Genders
Filed Under News, Personal on 2014-02-13, 13:11 | Leave a Comment
Facebook has added support for non-binary genders! Hooray! It looks like a free-form field, but it actually only allows you to select from a list of almost 50 pre-defined genders. Here’s that list:
Agender
Androgyne
Androgynous
Bigender
Cis
Cis Female
Cis Male
Cis Man
Cis Woman
Cisgender
Cisgender Female
Cisgender Male
Cisgender Man
Cisgender Woman
Female to Male
FTM
Gender Fluid
Gender Nonconforming
Gender Questioning
Gender Variant
Genderqueer
Intersex
Male to Female
MTF
Neither
Neutrois
Non-Binary
Pangender
Trans
Trans Female
Trans Male
Trans Man
Trans Person
Trans Woman
Trans*
Trans* Female
Trans* Male
Trans* Man
Trans* Person
Transgender Female
Transgender Person
Transmasculine
Transsexual
Transsexual Male
Transsexual Man
Transsexual Person
Transsexual Woman
Two-spirit
Let me know if I missed any from the Facebook list! (I’m sure there are some missing from Facebook’s list)
There are still a few issues people are running into such as being forced to choose Son/Daughter for children and “Interested In” is still limited to Female/Male, but at least this is a highly visible step in the right direction.
How To Clean an Apple Aluminum Keyboard
Filed Under Apple, Geek, Lifehacks on 2013-11-07, 17:30 | 3 Comments
My Apple keyboard gets awfully dirty over the years, but is built well enough to not need replacing. That means I end up with a grimy but functional keyboard. I decided it was finally time to clean my work keyboard since I hadn’t in almost 4 years. How to clean it though? Quite simply, get some baby wipes and scrub each key individually. Here’s the before and after:
-- 3 Comments
Go Splunk Yourself!
Filed Under Gadgets & Hardware, Geek, Self Tracking on 2013-10-17, 10:29 | 10 Comments
Full Disclaimer: I’ve been working at Splunk for close to 4 years now as a software engineer. For those that aren’t familiar with Splunk, it’s a tool intended to collect machine generated data (aka log files), index it, and allow you to search and report on it. Most companies use Splunk in their IT department to monitor and troubleshoot problems, but it’s really starting to branch out into all areas of businesses. After discovering Splunk, it didn’t take long for me to realize I could use it myself even though I wasn’t running a huge IT department. Of course I threw a bunch of my web server logs at it and started fixing errors, but that’s par for the course. Things started getting interesting when I decided I was going to Splunk myself.
With the rise of the Quantified Self movement, more and more biometric devices and self-tracking tools are becoming available to normal consumers. As we start using more devices that track more variables, the amount of data generated frows exponentially. Devices like the Basis allow you to track things like your heart rate or skin temperature on a minute by minute basis, resulting in thousands of data points every day. It’s debatable whether we can call this “Big” Data since it only accounts to a few megabytes, but it definitely scales outside the realm of manual handling very quickly.
The Basis is just one device that you can use to help track yourself. There are hundreds more. Personally I’m currently (or within the past year) tracking the following:
Hardware:
- Fitbit Zip – steps (also tracking my cat Bunki with a Fitbit)
- Nike Fuelband – steps and activities
- Basis B1 Band – steps, heart rate, skin temperature, air temperature, and galvanic skin response
- Withings scale – weight and fat mass
- Garmin Forerunner 610 – GPS location, heart rate (paired with a Wahoo ANT+ HRM), and pace for my runs and bike rides
- Lumoback – posture
- Zeo – brain activity during sleep (Company out of business)
- Automatic – tracking car trips, mpg, and driving habits
Software:
- Moves (iOS/Android) – steps, passive tracking of places I’ve been, cycling, running
- Openpaths (iOS/Android) – geolocation
- Google Latitude (service discontinued) – geolocation
- foursquare (iOS/Android) – active tracking of places I’ve been
- Last.fm – Music listening habits
- Biologger – a custom web based app for tracking things like sneezes, last time I cleaned the litterbox, did the dishes, headaches, dyed my hair, etc.
- Email inbox – custom script for checking number of read and unread messages in my inbox
- Twitter – tracking my tweets @edrabbit
Each of these devices or apps has their pros and cons. Battery life, ease of syncing, and of course quality of data are all factors. But the biggest issue I ran into with Splunking myself was getting my data out of all these services.
If I was really lucky, a full-featured API was available (like Fitbit’s). Other times I had to settle for an export in CSV or some other format (like Zeo). Unfortunately there are a few services/devices that just don’t offer any official way to get your data out (I’m looking at you Basis).
Over time I was able to find a number of tools written by others to help free your data. Additionally I wrote several of my own tools to extract data and transform it into human-readable and Splunk-friendly log formats. All of my tools are available on my github page. I’ve got tools to fetch and/or format data from Fitbit, Nike Fuelband, Twitter, Google Latitude, GPX files, CSV files, Zeo, foursquare, and Basis.
But wait, I said Basis didn’t have any way to get your data out! As an excellent example of users finding ways to use things the way they want, there is a way to get your data out of Basis. One Basis user (Bob Troia) discovered that while Basis doesn’t offer an API to user, they do have an internal API where JSON is passed through the browser in order to show you dashboards with your data. All it took was a little bit of scripting to grab this automatically and suddenly we all had control of our own data. You can find his Basis Data export tool here. This was great, but the data was exported in a horrible combination of JSON and CSV. Luckily one of my scripts can turn it into minute by minute log files as if they were generated on the fly. There are a bunch of other self-tracking hackers out there building tools like this. They’re often easy to find, but to help I’ve started to try to catalog them at wiki.biologger.com
Armed with all these devices generating data and the appropriate tools for fetching and formatting it correctly, I was finally able to feed all of this into Splunk. Let’s take a look at some of what I’m able to get out of this.
I have around 1.5 million events logged in Splunk, taking up only a couple hundred megabytes. For anyone already familiar with Splunk, this is obviously within the 500mb index limit of the free product, which means anyone can do this without shelling out cash for a license.
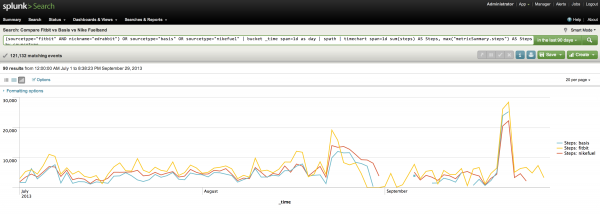
One of the most common questions when people learn I’m using all these devices is how they compare to each other. Previously I could only give a vague sort of answer about how I thought the Fitbit was the most accurate and that the other devices where a few thousand off each day. But with Splunk I’m able to generate a visualization comparing the Fitbit with the Basis and the Fuelband. It’s true, they don’t give similar numbers, but they do seem to track similarly over time.
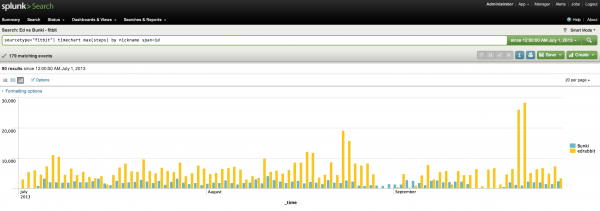
How do I compare to Bunki in steps?
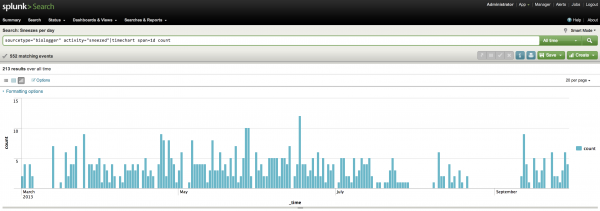
How many times have I sneezed each day?
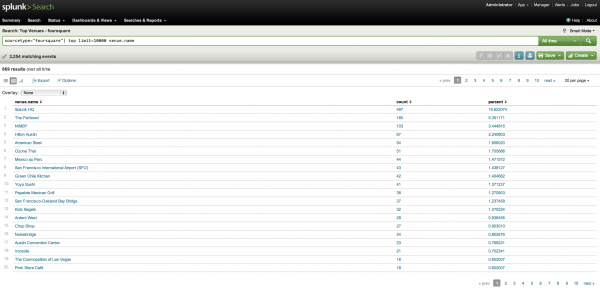
What venues have I checked in at with foursquare the most over the past 8 years?
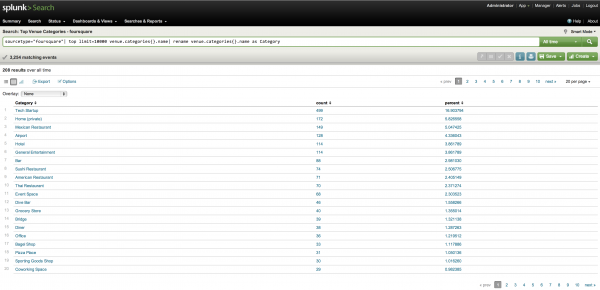
What kind of venues do I tend to check in at?
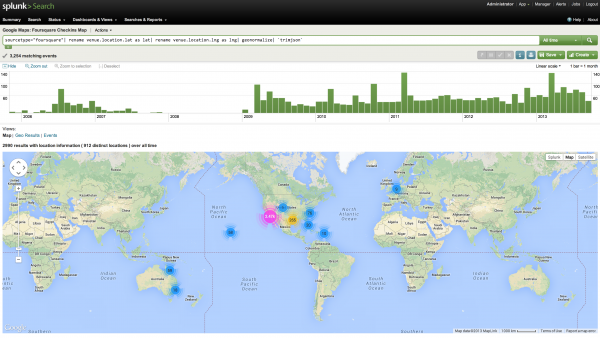
With the Google Maps App for Splunk 5 I can even plot all of these checkins on an interactive map. (The newest version of Splunk 6 comes with maps built in)
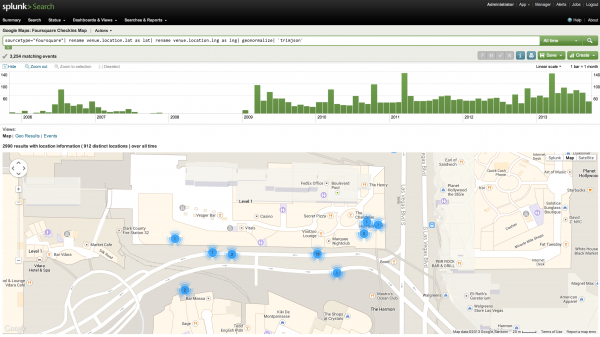
I can also use this to see exactly where I went on trips, what restaurants I ate at, and what activities I did. So next time a friend asks what’s good to do in a city I’ve visited I can just pull up the map and show them exactly where to go. Here’s an example map from Splunk’s .conf in Vegas last year:
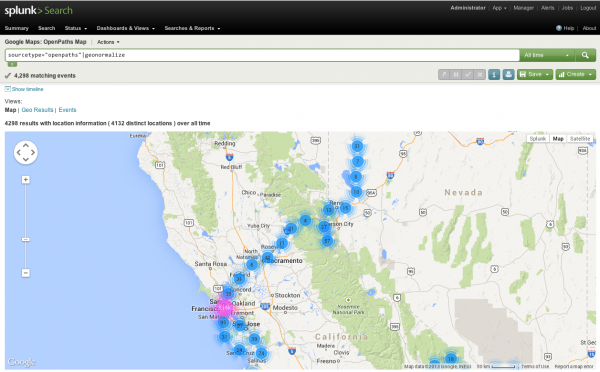
The maps above are based on foursquare data, which requires active check-ins at specific venues. However tools like Google Latitude and Openpaths simple record latitude and longitude over time, so you get a more detailed report on my movements. Here’s Openpaths tracking me around San Francisco and my journeys to the Black Rock Desert.
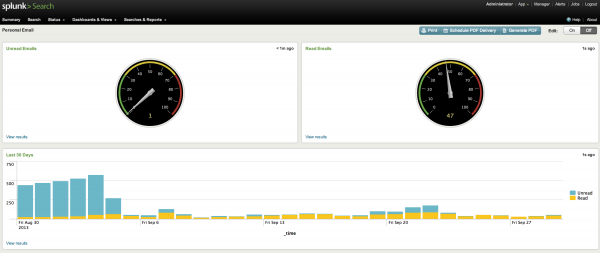
Or how about the current state of my email inbox? I’m tempted to put this up on a screen at home so I can see how many unread messages I have without having to open up my inbox.
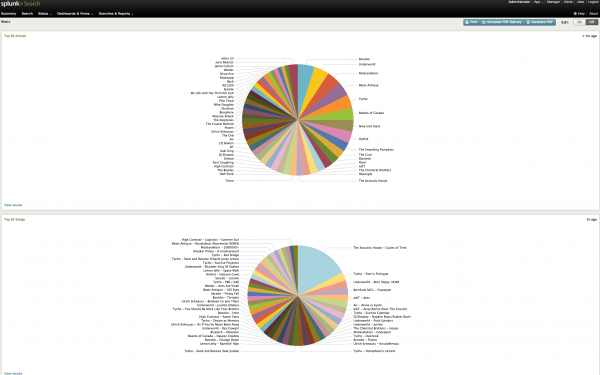
What about my favorite music based on Last.fm? This is an interesting one that also shows off how multipurpose Splunk can be. As you can see I listened to a single song (The Acoustic Hoods – Cycles of Time) several times more than all other songs. In Splunk I can click on that pie piece and it will show me every single time that song was logged as played. Turns out I left the song running on repeat on my work computer when I went home for the evening and it looped all night long. Oops. Luckily with Splunk it’s easy to just exclude those events to get a more realistic picture if that’s what I wanted.
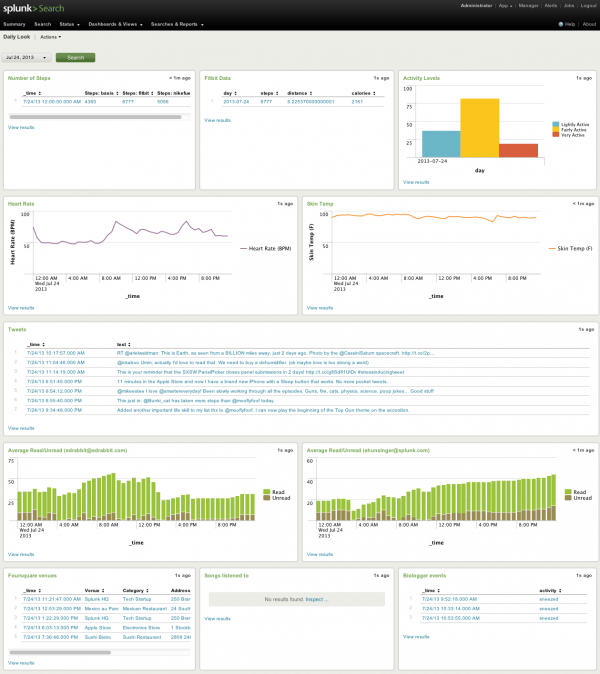
This is all pretty simple stuff that even the newest of Splunk users can do. It’s mainly looking at just one data source. What I really wanted was to be able to see a picture of any day of my life and know what that day was like for me. SO I put together a dashboard that lets me do just that. It pulls in info from various different services that have vastly different formats and lets me see it all on one page instantly. No more clicking from site to site to site. I’m still working on getting more and more relevant data in, but if you take a look at the screenshot below you’ll see exactly what July 24th, 2013 looked like for me. Based on my heart rate around 9am and 6pm it looks like I biked to work, I ate lunch at Mexico au Parc, went to the Apple store to get my iPhone replaced, sneezed 3 times in the morning, and learned how to play Top Gun on the accordion.
What’s next?
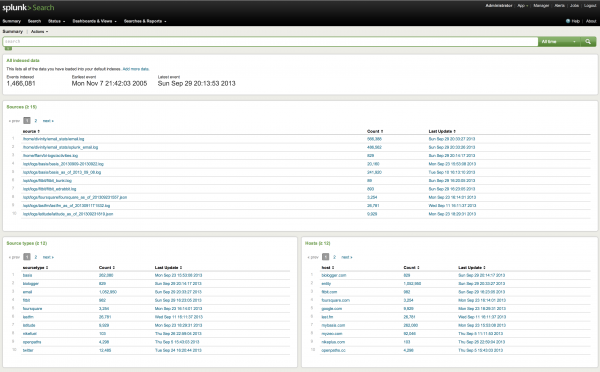
Keen-eyed Splunk users will notice in the Summary screenshot that some of the data sources are data dumps and not actually feeding into Splunk live. I want to work on getting everything feeding into Splunk automatically so it is all constantly up to date rather than have to take 20 minutes to sit down and get new data dumps from the various services.
I also want to start Splunking my house. I’ve got a Nest, a wifi washing machine, and more and more devices becoming internet enabled. It’s just a matter of grabbing it and feeding it into Splunk.
You can download the free version of Splunk which is available for almost every platform, or you can give our hosted (and also free) Splunk Storm a try. There’s a slight learning curve to using Splunk, but if you can use Google, you can learn to use Splunk. I’d love to hear from anyone else out there that either wants to or already has started Splunking themselves. Shoot me an email or drop me a tweet @edrabbit!
Tagged: Quantified Self, Splunk
-- 10 Comments
Quantified Hiking in Point Reyes
Filed Under Geek, Self Tracking on 2013-09-27, 10:30 | Leave a Comment

I spent the past weekend in the woods along the coast of California, away from the internet but still geeking out with more devices than I should have on the trail.
The plan was to hike from the Education Center of Point Reyes down along the Coast Trail, and spend the night at Glen Camp. Then we’d turn around and head back up, clocking in about 9 miles each way. I packed my bag, laced up my boots and put together an arsenal of tracking devices and off we went.
I brought with me my normal daily carry quantifying gadgets which included the Basis watch, a Nike Fuelband, and a Fitbit Zip. I decided to put my phone in airplane mode for the hike so I could conserve battery for taking photos. That meant I didn’t have any tracking with foursquare, Moves, openPaths, or any other apps. I also brought along my Garmin Forerunner 610 with the Wahoo ANT+ heart rate strap which turned out to be quite sweaty, but worth it for the data. And of course my Garmin Vista HCx GPSr which always goes with me on trips. I also brought a Newtrent 7000mAh USB battery pack for recharging devices as needed since just about everything is chargeable over USB. I ended up only needing to charge the Forerunner overnight.
We parked our cars at the Educational Center in Point Reyes and started down, or rather up, the Laguna trail at about 2013-09-21 13:08:27. Laguna connected up with the Fire Lane trail which took us to Coast Camp and our first glimpse of the beach only 40 minutes into our hike. After stopping for lunch under a giant eucalyptus tree we got back on the Coast Trail (14:50), stopping several miles later at Kelham Beach for awhile (16:09 – 17:21).
While exploring the beaches I turned off my Garmin Forerunner watch because I wasn’t sure how long the battery would actually last: a very common problem with all these tracking devices. So I didn’t get my heart rate as much on the first day, but still got a bunch of GPX tracks. We finally made it into Glen Camp around 18:57, and set up camp as the sun was setting, but not before meeting a banana slug at 18:00 who was hanging out with some mushrooms at 37°59’36” N 122°48’21” W.
We spent the evening cooking a delicious dinner, and Tim made Bananas Foster for desert to celebrate the motivation for this trip, Mella’s birthday! Yes, Tim hiked in a full pound of brown sugar, half a pound of butter, and a small bottle of Hennessey to make that happen. That night we also got to hear first hand “what the fox says” and were comforted in knowing that it was foxes and not actually someone being murdered.
The next morning we awoke, packed things up, and got back on the trail around 12:08:06. We stopped off at Arch Rock for lunch around 13:15, got back on the trail at 14:19, took a side detour to Sculptured Beach at 15:42 and then got back on the trail at 16:52. For some reason, my Garmin Vista HCx stopped tracking around 18:15, but my Garmin Forerunner tracked me all the way to the parking lot, putting my feet on concrete ten minutes later at 18:25.
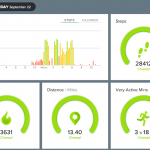
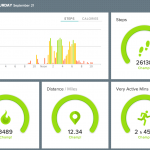
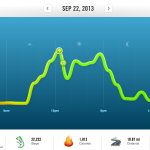
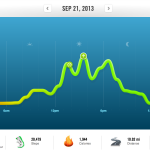
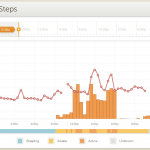
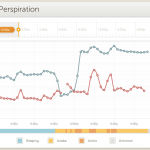
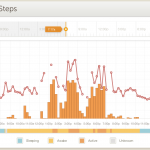
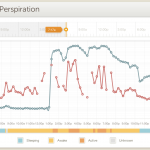
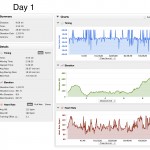
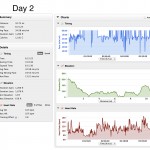
Here’s some more screenshots from my Nike Fuelband, Fitbit and Basis showing some of my stats for the weekend:
Hit the Garmin Connect activity pages if you want to see some nice stats of the trip, including playing back our journey on a map:
Pt Reyes Backpacking Trip Day 1
Pt Reyes Backpacking Trip Day 2
View the entire trip in EveryTrail here.
Or grab the raw GPX files for fun:
Garmin Vista GPX file from 2013-09-21
Garmin Forerunner GPX file from 2013-09-21
Garmin Vista GPX file from 2013-09-22
Garmin Forerunner GPX file from 2013-09-22
In the end, according to Fitbit, I clocked in over 54,000 steps for the weekend, and Fitbit says almost 26 miles but I think my stride might be a bit off as the GPS devices put it closer to 20 miles. I was able to add 11,694 Fuel points to my account.
I learned that I do indeed sweat a lot while hiking. The interesting thing was that I continued to sweat Sunday evening even though we were just riding in a car. Not sure if that’s accurate or if the Basis was just confused.
I also learned that I start hurting and feeling tired while hiking if my heart rate gets up over 110. Being able to glance down at my watch and monitor my heart rate was great for helping me slow down and take it easy, making sure I’d make it back to civilization. After all, it wasn’t a sprint with a 30 pound pack, but closer to a marathon with one.
Flying Ostrich Quadcopter
Filed Under Geek, Video on 2013-07-31, 11:26 | 1 Comment
Perhaps the first flying ostrich? OstrichCopter was created by visual artist Bart Jansen and technical engineer Arjen Beltman. You might remember them as the ones also responsible for Orvillecopter (the flying taxidermal cat quadcopter) The ostrich, which probably dreamed of flying while alive, died of disease.
Tagged: quadcopter, taxidermy
-- 1 Comment
Turning Geolocation Data Into Music
Filed Under Art, Geek, Self Tracking, Video on 2013-07-22, 23:50 | Leave a Comment
If you’ve been tracking your own personal data for awhile like I have, you probably found yourself at one point asking, “Great, now what do I do with all of this?” If you’re Brian House, the answer is: make a record.
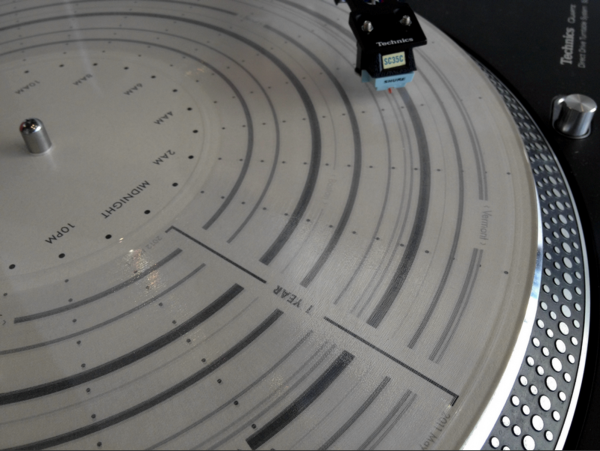
Brian collected a years worth of gelocation data through an iOS app called OpenPaths and transformed it into a physical vinyl record. His project, titled “Quotidian Record”, is a beautiful white vinyl with each day represented with a revolution of the record. You can read more about his project in his blog post and this Wired article.
Tagged: openpaths, Quantified Self


